
NYY @ SF

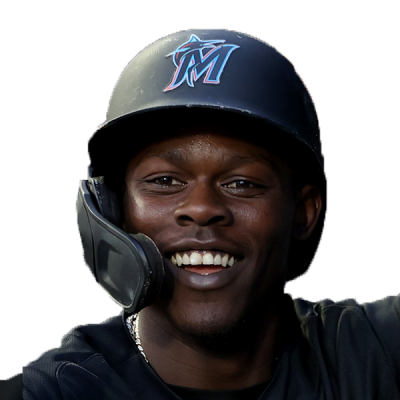


Yankees @ Giants 2025 WorldSeries Matchup Details
2025 World
Date : Todays Game is on Wednesday, March 25th
Time : 25/03/26 20:05:00 PM EST First Pitch
Positives for the New York Yankees World Game Today
The leading projection system (THE BAT) ranks Oracle Park as the 4th-best stadium in the majors for left-handed batting average.
The shallowest right field fences in MLB are found in Oracle Park.
With a 35.100 Expected Home Runs per 600 plate appearances (an advanced metric created by the leading projection system (THE BAT X) using Statcast data) since the start of last season , Jazz Chisholm Jr. is positioned in the 95th percentile for power.
Jazz Chisholm Jr.’s 16.4% Barrel% (an advanced metric to study power) ranks in the 95th percentile since the start of last season.
Since the start of last season, Jazz Chisholm Jr.’s flyball exit velocity (an advanced standard to evaluate power) is in the 84th percentile at 95.1 mph.
Since the start of last season, Matt Chapman has an average exit velocity of 92.3 mph, which ranks among the elite in baseball at the 92nd percentile.
Placing in the 86th percentile, Matt Chapman has posted a .329 Isolated Power rate (ISO) since the start of last season.
In terms of plate discipline, Matt Chapman’s skill is quite impressive, posting a 1.74 K/BB rate since the start of last season while ranking in in the 79th percentile.
Jung Hoo Lee has recorded a .273 Expected Batting Average since the start of last season, grading out in the 80th percentile according to the leading projection system (THE BAT X)’s interpretation of Statcast data.
When it comes to plate discipline, Jung Hoo Lee’s ability is quite good, posting a 1.5 K/BB rate since the start of last season while placing in in the 89th percentile.
Jung Hoo Lee has recorded a .270 batting average since the start of last season, ranking in the 76th percentile.
Oracle Park profiles as the #4 field in the game for righty batting average, according to the leading projection system (THE BAT).
Willy Adames’s 12.4% Barrel% (an advanced stat to assess power) grades out in the 81st percentile since the start of last season.
Willy Adames’s 94.5-mph exit velocity on flyballs (a reliable standard to measure power) grades out in the 79th percentile since the start of last season.
Willy Adames has done a strong job optimizing his launch angle on his highest exit velocity balls. His 24° mark is among the highest in Major League Baseball since the start of last season (100th percentile).
Grading out in the 86th percentile for power, Willy Adames has averaged 28.9 dingers per 600 plate appearances since the start of last season.
Utilizing Statcast metrics, Luis Arraez grades out in the 97th percentile according to the leading projection system (THE BAT X)’s version of Expected Batting Average since the start of last season at .301.
Luis Arraez is in the 96th percentile when it comes to hitting balls between -4° and 26°, the launch angle range that tends to optimize base hits (50.7% rate since the start of last season).
As it relates to plate discipline, Luis Arraez’s skill is quite good, posting a 0.52 K/BB rate since the start of last season while placing in in the 100th percentile.
Ben Rice has suffered from bad luck when it comes to his wOBA since the start of last season; his .358 mark is deflated compared to his .422 Expected wOBA, based on the leading projection system (THE BAT X)’s interpretation of Statcast data.
Since the start of last season, Ben Rice’s 15.8% Barrel%, a reliable standard for measuring power, places him in the 94th percentile among his peers.
Since the start of last season, Ben Rice has an average exit velocity of 93.3 mph, which ranks among the elite in MLB at the 97th percentile.
Patrick Bailey is in the 87th percentile when it comes to hitting balls between 23° and 34°, the launch angle range that tends to optimize home runs (18.8% rate since the start of last season).
Rafael Devers’s 15.8% Barrel% (an advanced metric to measure power) ranks in the 94th percentile since the start of last season.
Ranked in the 98th percentile, Rafael Devers has one of the highest average exit velocities in the majors since the start of last season (93.4-mph).
Checking in at the 93rd percentile, Rafael Devers has put up a .369 wOBA (widely regarded as the top measure of overall offense) since the start of last season.
Based on Statcast metrics, the leading projection system (THE BAT X)’s version of Expected HR per 600 plate appearances (26.9) may lead us to conclude that Harrison Bader has been unlucky since the start of last season with his 20.4 actual HR/600.
By putting up a .349 wOBA (a leading indicator of offensive ability) since the start of last season, Harrison Bader grades out in the 81st percentile.
Harrison Bader has notched a .361 BABIP since the start of last season, placing in the 99th percentile.
Austin Wells’s 20.5° launch angle (an advanced metric to measure a batter’s ability to lift the ball for power) is among the highest in baseball: 94th percentile.
Since the start of last season, Trent Grisham’s 14.5% Barrel%, a reliable stat for measuring power, places him in the 90th percentile among his peers.
Since the start of last season, Trent Grisham’s flyball exit velocity (an advanced standard to assess power) ranks in the 89th percentile at 96 mph.
Trent Grisham and his 19.1° launch angle on his hardest-hit balls rank in 94th percentile, among the highest in baseball since the start of last season.
Generating 18.3 outs per start since the start of last season on average, Max Fried places him the 96th percentile.
The leading projection system (THE BAT) projects Oracle Park as the worst field in Major League Baseball for walks.
Max Fried was on point in his previous outing and conceded 2 ER.
Max Fried’s high usage percentage of his secondary pitches (58.2% since the start of last season) ought to work in his favor considering they are typically much more effective than fastballs.
Logan Webb has recorded 18.3 outs per GS since the start of last season, placing in the 96th percentile.
It may be wise to expect worse numbers for the New York Yankees offense in future games, given that the leading projection system (THE BAT X) believes they are the luckiest offense in MLB since the start of last season.
Logan Webb’s high utilization percentage of his secondary pitches (58.6% since the start of last season) ought to work in his favor since they are typically much more effective than fastballs.
Heliot Ramos’s maximum exit velocity (a reliable metric to study power) has been 116 mph since the start of last season, placing in the 93rd percentile.
With a 28.200 Expected Home Runs per 600 plate appearances (an advanced metric created by the leading projection system (THE BAT X) using Statcast data) since the start of last season , Rafael Devers has performed in the 86th percentile for power.
Since the start of last season, Aaron Judge’s 25.6% Barrel%, a reliable standard for measuring power, places him in the 100th percentile among his peers.
Since the start of last season, Aaron Judge has an average exit velocity of 95.6 mph, which is among the best in the game at the 100th percentile.
When it comes to hitting balls between 23° and 34° (the launch angle range that tends to result the most in home runs), Aaron Judge and his 21.1% rank in the 99th percentile since the start of last season.
Posting a .464 wOBA (a leading indicator of offensive ability) since the start of last season, Aaron Judge has performed in the 100th percentile.
Giancarlo Stanton’s 21.2% Barrel% (a reliable standard to assess power) is in the 99th percentile since the start of last season.
Giancarlo Stanton’s maximum exit velocity (a reliable standard to assess power) has been 118 mph since the start of last season, placing in the 99th percentile.
Giancarlo Stanton grades out in the 88th percentile when it comes to hitting balls between 23° and 34°, the launch angle range that tends to optimize home runs (20% rate since the start of last season).
Sporting a .385 wOBA (a leading indicator of offensive ability) since the start of last season, Giancarlo Stanton has performed in the 98th percentile.
Giancarlo Stanton has hit 46.1 dingers per 600 plate appearances since the start of last season, checking in at the 99th percentile for power.
Aaron Judge has notched a .507 Isolated Power rate (ISO) since the start of last season, ranking in the 100th percentile.
Cody Bellinger’s 18.5° launch angle (an advanced standard to study a batter’s ability to lift the ball for power) is among the most flyball-inducing in baseball: 87th percentile.
Posting a .485 Slugging Percentage (SLG) since the start of last season, Cody Bellinger is ranked in the 87th percentile.
With a .279 batting average since the start of last season, Cody Bellinger finds himself in the 87th percentile.
Jose Caballero grades out in the 89th percentile when it comes to hitting balls between 23° and 34°, the launch angle range that tends to result the most in home runs (18.9% rate since the start of last season).
Jazz Chisholm Jr. and his 21.8° launch angle on his hardest-contacted balls rank in 98th percentile, among the highest in the game since the start of last season.
Since the start of last season, Jerar Encarnacion’s flyball exit velocity (a reliable metric to study power) grades out in the 88th percentile at 95.9 mph.
The standard deviation of Jerar Encarnacion’s launch angle since the start of last season (22.1°) is in the 95th percentile. A low mark like this tends to lead to a higher rate of base hits.
By putting up a 1.6 K/BB rate since the start of last season, Cody Bellinger has shown favorable plate discipline, checking in at the 84th percentile.
Logan Webb has posted a 26.6% K% since the start of last season, checking in at the 86th percentile.
Jose Caballero ranks in the 92nd percentile when it comes to hitting balls between -4° and 26°, the launch angle range that tends to result the most in base hits (49.1% rate since the start of last season).
Posting a .326 BABIP since the start of last season, Jose Caballero has performed in the 83rd percentile.
Ben Rice is in the 79th percentile when it comes to hitting balls between 23° and 34°, the launch angle range that tends to best-produce home runs (17.9% rate since the start of last season).
Grading out in the 84th percentile, Trent Grisham sits with a .352 wOBA (widely regarded as the top indicator of overall offense) since the start of last season.
Austin Wells has performed at a clip of 25.4 Expected Home Runs per 600 plate appearances since the start of last season, checking in at the 75th percentile for power according to the leading projection system (THE BAT X)’s interpretation of Statcast data.
Ranking in the 86th percentile, Austin Wells sports a .327 Isolated Power rate (ISO) since the start of last season.
Ryan McMahon’s 12.4% Barrel% (an advanced metric to study power) ranks in the 81st percentile since the start of last season.
Since the start of last season, Ryan McMahon has an average exit velocity of 93.2 mph, which ranks among the best in the majors at the 96th percentile.
Ryan McMahon ranks in the 90th percentile when it comes to hitting balls between -4° and 26°, the launch angle range that tends to optimize base hits (48.6% rate since the start of last season).
When it comes to hitting balls between 23° and 34° (the launch angle range that tends to optimize home runs), Ryan McMahon and his 17.6% rank in the 75th percentile since the start of last season.
Jerar Encarnacion has had some very poor luck with his batting average since the start of last season; his .200 rate is a good deal lower than his .264 Expected Batting Average, based on the leading projection system (THE BAT X)’s interpretation of Statcast data.
Negatives with the San Francisco Giants World Game Today
The league’s highest fences can be found at Oracle Park.
Jazz Chisholm Jr. has been very fortunate when it comes to his batting average since the start of last season; his .242 mark is inflated compared to his .222 Expected Batting Average, based on the leading projection system (THE BAT X)’s interpretation of Statcast data.
Oracle Park grades out as the #28 stadium in Major League Baseball for right-handed home runs, per the leading projection system (THE BAT).
Built just 8 feet above sea level, Oracle Park has one of the lowest altitudes in the majors, which tends to lead to worse offense.
Based on Statcast metrics, the leading projection system (THE BAT X)’s version of Expected HR per 600 plate appearances (19.5) suggests that Matt Chapman has been lucky since the start of last season with his 23.6 actual HR/600.
Matt Chapman has done a weak job optimizing his launch angle on his hardest-contacted balls. His 7.5° angle is among the lowest in the game since the start of last season (13th percentile).
Since the start of last season, Jung Hoo Lee’s 3.5% Barrel%, an advanced stat for measuring power, places him in the 10th percentile among his peers.
Jung Hoo Lee’s maximum exit velocity (an advanced metric to study power) has been 107.2 mph since the start of last season, placing in the 5th percentile.
Jung Hoo Lee has done a weak job optimizing his launch angle on his highest exit velocity balls. His 7.6° mark is among the lowest in baseball since the start of last season (14th percentile).
Matt Chapman has posted a .232 Expected Batting Average since the start of last season, ranking in the 25th percentile according to the leading projection system (THE BAT X)’s interpretation of Statcast data.
The standard deviation of Matt Chapman’s launch angle since the start of last season (29.7°) is in the 14th percentile. A high deviation like this tends to lead to a lower BABIP.
Matt Chapman has put up a .267 BABIP since the start of last season, grading out in the 19th percentile.
Based on Statcast metrics, Jung Hoo Lee grades out in the 8th percentile for power according to the leading projection system (THE BAT X)’s version of Expected Home Runs per 600 plate appearances since the start of last season at 4.900.
The leading projection system (THE BAT) profiles Oracle Park as the worst stadium in the majors for LHB home runs.
Luis Arraez has had some very good luck with his home runs since the start of last season; his 7.1 HR per 600 plate appearances figure is considerably higher than his 0.0 Expected HR/600, based on the leading projection system (THE BAT X)’s interpretation of Statcast data.
Since the start of last season, Luis Arraez’s 1.1% Barrel%, a reliable stat for measuring power, places him in the 2nd percentile among his peers.
Since the start of last season, Luis Arraez’s flyball exit velocity (a reliable metric to measure power) is in the 1st percentile at 86 mph.
12% of the time that Ben Rice has started against a northpaw since the start of last season, he has been pinch hit for.
Based on Statcast data, the leading projection system (THE BAT X)’s version of Expected wOBA (.250) may lead us to conclude that Patrick Bailey has been very fortunate since the start of last season with his .265 actual wOBA.
Patrick Bailey’s 5.6% Barrel% (a reliable metric to study power) grades out in the 23rd percentile since the start of last season.
Since the start of last season, Patrick Bailey’s flyball exit velocity (a reliable stat to measure power) ranks in the 20th percentile at 90.4 mph.
When it comes to his wOBA and overall offense, Rafael Devers has experienced some positive variance since the start of last season. His .365 rate has been quite a bit higher than the leading projection system (THE BAT X)’s version of Statcast-based Expected wOBA (xwOBA) at .348.
Rafael Devers is notably slow, ranking in the 5th percentile in Sprint Speed at 24.98 ft/sec since the start of last season.
Harrison Bader’s 87.2-mph average exit velocity ranks among the worst in baseball since the start of last season: 13th percentile.
Harrison Bader grades out in the 12th percentile when it comes to hitting balls between 23° and 34°, the launch angle range that tends to result the most in home runs (12.9% rate since the start of last season).
The standard deviation of Harrison Bader’s launch angle since the start of last season (30.6°) is in the 6th percentile. A high figure like this tends to lead to a lower rate of hits on balls in play.
Austin Wells has put up a .228 Expected Batting Average since the start of last season, grading out in the 22nd percentile according to the leading projection system (THE BAT X)’s interpretation of Statcast data.
Grading out in the 25th percentile for Sprint Speed at 26.43 ft/sec since the start of last season, Austin Wells is notably slow.
Austin Wells has shown poor plate discipline since the start of last season, grading out in the 18th percentile with a 4.11 K/BB rate.
Sporting a .253 BABIP since the start of last season, Austin Wells is positioned in the 6th percentile.
As it relates to his home runs, Trent Grisham has had positive variance on his side since the start of last season. His 35.1 HR per 600 plate appearances mark has been a good deal higher than the leading projection system (THE BAT X)’s version of Statcast-based Expected HR/600 at 28.1.
Using Statcast metrics, Trent Grisham ranks in the 18th percentile per the leading projection system (THE BAT X)’s version of Expected Batting Average since the start of last season at .224.
With a .261 BABIP since the start of last season, Trent Grisham is ranked in the 15th percentile.
The San Francisco Giants have been the unluckiest offense in MLB since the start of last season, according to the leading projection system (THE BAT X), and are likely to positively regress the rest of the season,Logan Webb’s 91.9-mph fastball velocity since the start of last season ranks in the 24th percentile among all starting pitchers.
Logan Webb’s 2118-rpm fastball spin rate since the start of last season ranks in the 14th percentile out of all SPs.
The 12% Barrel% of the New York Yankees makes them the #1 squad in baseball since the start of last season by this metric.
New York’s 90.7-mph average exit velocity since the start of last season is among the best in the league: #1 overall.
Heliot Ramos and his 8.2° launch angle on his highest exit velocity balls rank in 17th percentile, among the lowest in the game since the start of last season.
As it relates to his wOBA and overall offense, Trent Grisham has been lucky since the start of last season. His .353 mark has been significantly inflated relative to the leading projection system (THE BAT X)’s version of Statcast-based Expected wOBA (xwOBA) at .340.
Based on Statcast data, the leading projection system (THE BAT X)’s version of Expected Batting Average (.287) suggests that Aaron Judge has had some very good luck since the start of last season with his .331 actual batting average.
As it relates to his home runs, Giancarlo Stanton has been lucky since the start of last season. His 51.2 HR per 600 plate appearances figure has been a good deal higher than the leading projection system (THE BAT X)’s version of Statcast-based Expected HR/600 at 38.0.
Based on Statcast data, the leading projection system (THE BAT X)’s version of Expected HR per 600 plate appearances (21.6) implies that Cody Bellinger has been very fortunate since the start of last season with his 26.5 actual HR/600.
Checking in at the 19th percentile, Cody Bellinger has hit 21.9% of his balls in the air since the start of last season with a velocity of 100+ mph.
Hitting the ball to all fields is an important skill for batting average that Cody Bellinger has struggled with since the start of last season, as evidenced by his ranking in the 25th percentile on THE BAT X’s Spray Score.
Posting a .224 Expected Batting Average (an advanced metric created by the leading projection system (THE BAT X) using Statcast data) since the start of last season , Willy Adames finds himself in the 18th percentile.
Willy Adames has compiled a .260 BABIP since the start of last season, placing in the 13th percentile.
When it comes to his batting average, Giancarlo Stanton has been very fortunate since the start of last season. His .273 mark has been a good deal higher than the leading projection system (THE BAT X)’s version of Statcast-based Expected Batting Average (xBA) at .210.
Jose Caballero has averaged 10.1 Expected Home Runs per 600 plate appearances since the start of last season, checking in at the 16th percentile for power according to the leading projection system (THE BAT X)’s interpretation of Statcast data.
Jose Caballero’s 6.1% Barrel% (an advanced standard to study power) ranks in the 25th percentile since the start of last season.
Jerar Encarnacion has been pulled from the game early 38% of the time when starting against a lefty on the mound since the start of last season.
Jerar Encarnacion has been very fortunate when it comes to his home runs since the start of last season; his 21.4 HR per 600 plate appearances mark is a good deal higher than his 10.0 Expected HR/600, based on the leading projection system (THE BAT X)’s interpretation of Statcast data.
In terms of the ability to lift the ball for power, Jerar Encarnacion ranks in just the 7th percentile with a 4° launch angle, which is one of the lowest angles in the game.
The #1 stadium in the game for suppressing strikeouts, per the leading projection system (THE BAT), is Oracle Park.
Given the 0.92 gap between Logan Webb’s 9.74 K/9 and his 8.82 estimated true talent K/9 (via the leading projection system, THE BAT), it’s safe to say he’s been one of the most fortunate pitchers in the game since the start of last season in terms of strikeouts and figures to perform worse in the future.
Jose Caballero’s 86.1-mph average exit velocity ranks among the worst in MLB since the start of last season: 6th percentile.
Patrick Bailey has notched a .264 wOBA (the best measure of overall offense) since the start of last season, placing in the 3rd percentile.
In terms of his wOBA and overall offense, Aaron Judge has had positive variance on his side since the start of last season. His .463 figure has been inflated compared to the leading projection system (THE BAT X)’s version of Statcast-based Expected wOBA (xwOBA) at .423.
Harrison Bader has been lucky in regards to his batting average since the start of last season; his .277 rate is inflated compared to his .243 Expected Batting Average, based on the leading projection system (THE BAT X)’s interpretation of Statcast data.
Based on Statcast metrics, Ryan McMahon ranks in the 13th percentile per the leading projection system (THE BAT X)’s version of Expected Batting Average since the start of last season at .219.
Placing in the 21st percentile, Ryan McMahon has notched a .294 wOBA (widely regarded as the top indicator of overall offense) since the start of last season.
In notching a .203 batting average since the start of last season, Ryan McMahon has performed in the 4th percentile.
Ranking in the 21st percentile, Ryan McMahon sports a .364 Slugging Percentage (SLG) since the start of last season.
When it comes to plate discipline, Jerar Encarnacion’s talent is quite bad, sporting an 18.22 K/BB rate since the start of last season while placing in in the 1st percentile.
Jerar Encarnacion has notched a .231 BABIP since the start of last season, ranking in the 20th percentile.
Latest San Francisco Giants Matches
- Padres vs Giants match player stats | 2026 Series Game 2 Saturday, September 12th
- Padres vs Giants match player stats | 2026 Friday, September 11th
- Cardinals vs Giants match player stats | 2026 Series Game 3 Wednesday, September 9th
- Cardinals vs Giants match player stats | 2026 Series Game 2 Tuesday, September 8th
- Cardinals vs Giants match player stats | 2026 Monday, September 7th
- Giants vs Mets match player stats | 2026 Series Game 3 Sunday, September 6th
- Giants vs Mets match player stats | 2026 Series Game 2 Saturday, September 5th
- Giants vs Mets match player stats | 2026 Friday, September 4th
- Giants vs Pirates match player stats | 2026 Series Game 3 Thursday, September 3rd
- Giants vs Pirates match player stats | 2026 Series Game 2 Wednesday, September 2nd
Latest New York Yankees Matches
- New York Mets at New York Yankees Odds MLB – Saturday 12th 2026
- Mets vs Yankees match player stats | 2026 Series Game 2 Saturday, September 12th
- New York Mets at New York Yankees Odds MLB – Friday 11th 2026
- Mets vs Yankees match player stats | 2026 Friday, September 11th
- Colorado Rockies at New York Yankees Odds MLB – Thursday 10th 2026
- Rockies vs Yankees match player stats | 2026 Series Game 3 Thursday, September 10th
- Colorado Rockies at New York Yankees Odds MLB – Wednesday 9th 2026
- Rockies vs Yankees match player stats | 2026 Series Game 2 Wednesday, September 9th
- Colorado Rockies at New York Yankees Odds MLB – Tuesday 8th 2026
- Rockies vs Yankees match player stats | 2026 Tuesday, September 8th